Introduction
When troubleshooting a physical network sensor, you visit this status page to generate a read-only report for your sensor.
From here, you can view the sensor's Overall Status, as well System Check reports, Interface Statuses, and Traffic Statuses.
This article covers the following topics:
Access the Status Page
If you are trying to access the console, or a legacy version of this status page, you may be asked to provide credentials. See "How do I Access my Physical Appliance" for more.
This page is hosted locally on each network sensor, which means it can only be accessed from within the network. When trying to access this page, make sure that your device is connected to the same network as the sensor.
Once connected to the same network, navigate to the following URL in your browser, replacing <local_ip_address> with your sensor's IP address:
https://<local_ip_address>/appliance_status/status
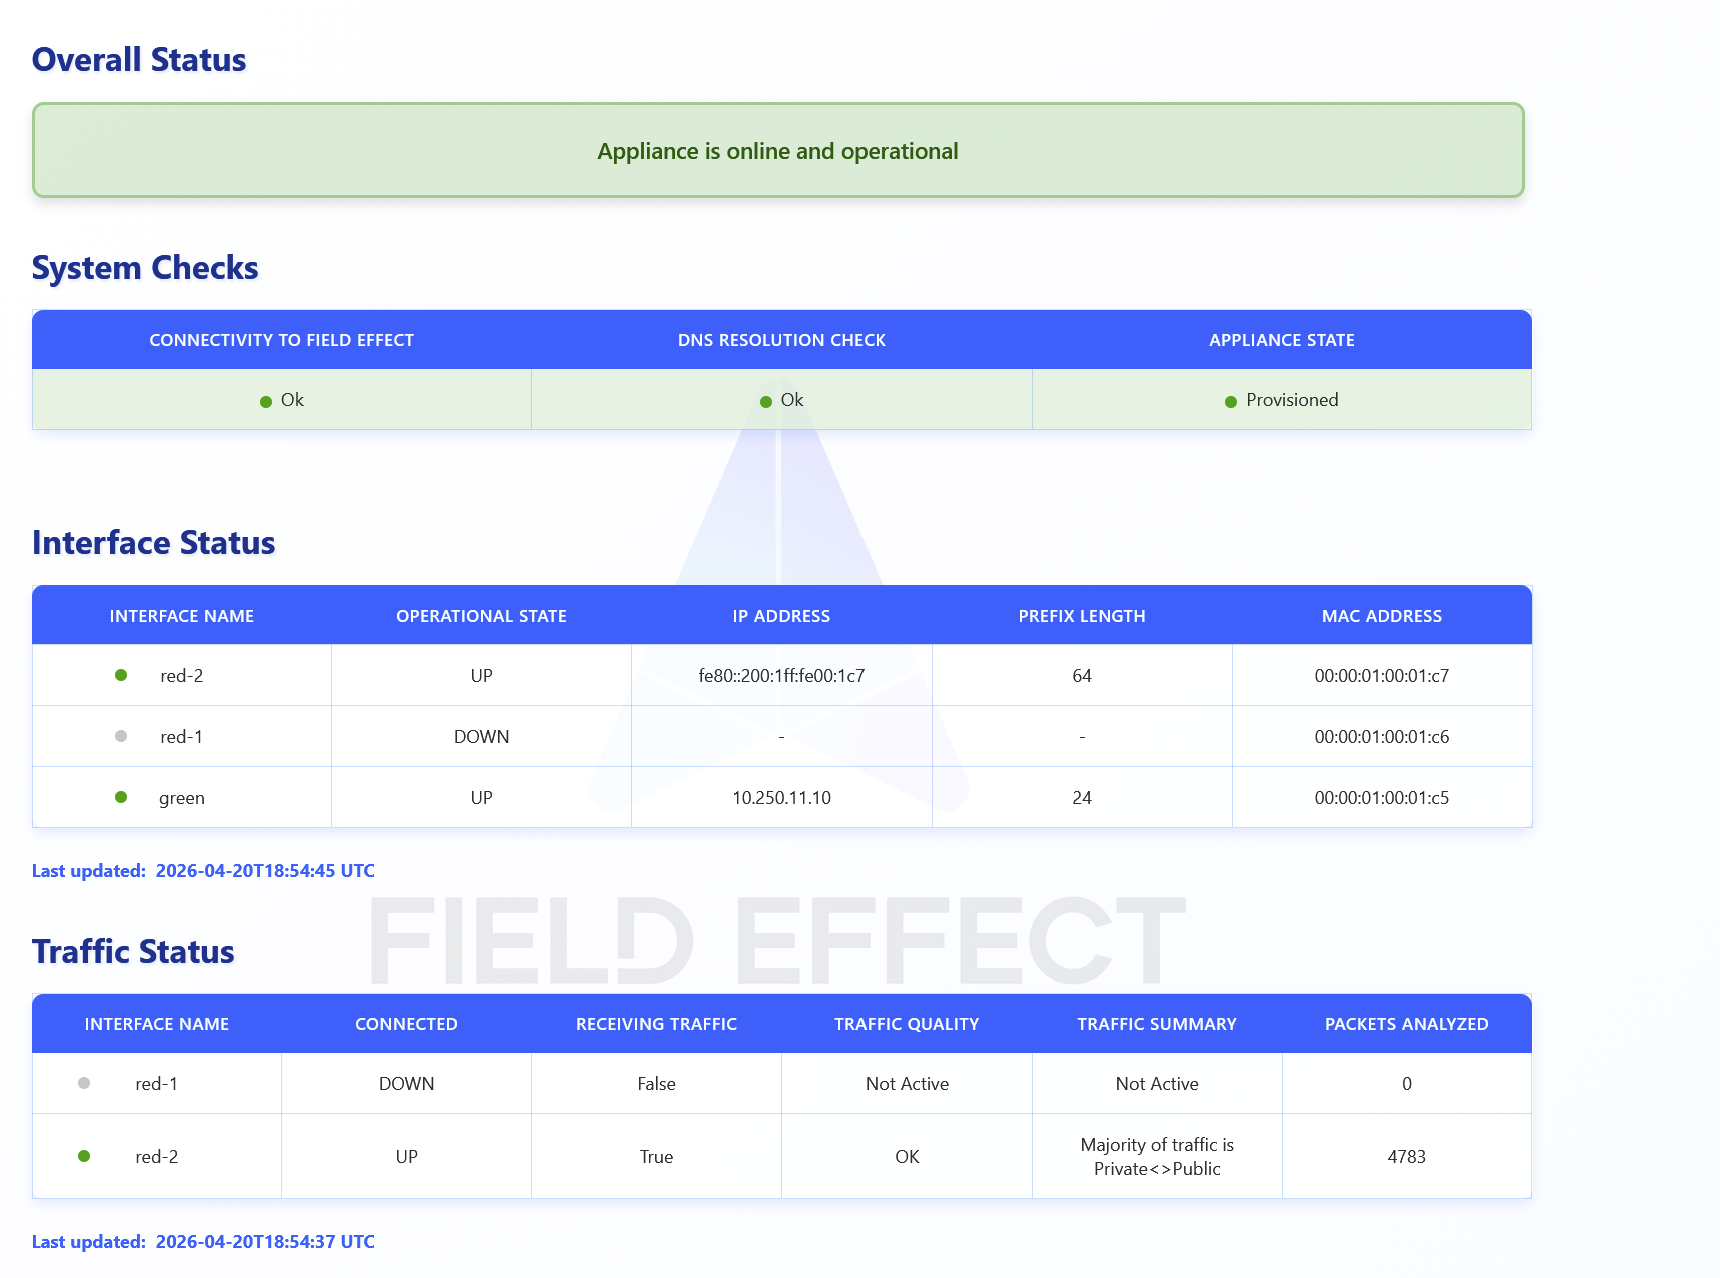
You'll be taken to its the status page. In the example below, the Status page is reporting on a sensor that is online and operational.
Reading The Status Page Metrics
The following sections of outline what is status reports on, the possible states they can take.
Overall Statuses
The first metric displayed on this page is an overall status for the sensor, which is presented by a color coded (green, yellow, or red) banner.
The example below shows an example of a sensor that online and operational:

The following example shows a sensor with a traffic issue:

The following example shows a sensor with a critical issue:

The table below describes all of the possible overall statuses an sensor may experience:
| Status | Message | Description |
|---|---|---|
| Unprovisioned | currently unprovisioned | Not currently provisioned or associated to a client organization. If you are a partner user, this sensor can be provisioned to a future end-client organization. |
| Provisioning | Currently provisioning | Associated to an end client and currently being provisioned for the new client organization. |
| Provisioned/Normal/OK | healthy and operational | Running as expected, and no action is required. |
| Traffic Issue | WARNING: No valid network traffic detected | The traffic being observed is not aligning with what is typical traffic for an organization. |
| Connectivity/DNS Issue | ACTION REQUIRED: Sensor will not function properly until connectivity issues are resolved | A critical error with either the sensor's connectivity or DNS configuration that is stopping the sensor from functioning properly. |
System Checks

This section reports on the sensor's critical systems, allowing for a quick diagnosis of each.
Connectivity to Field Effect: reports whether or not it can connect back to Field the Effect service. This system check will either report as "Ok" or "BAD - Unable to reach the Field Effect service".
DNS Resolution Check: reports whether or not it can successfully communicate with your organization's DNS server. This system check will report as either "Ok" or "BAD".
Refresh Times:
MDR SIEM sensors: every 10 seconds
Remote sensors: every 2 minutes
State: Reports weather the sensor is provisioned to an organization or not. This system check will report as either "Provisioned" or "Unprovisioned".
Interface Status
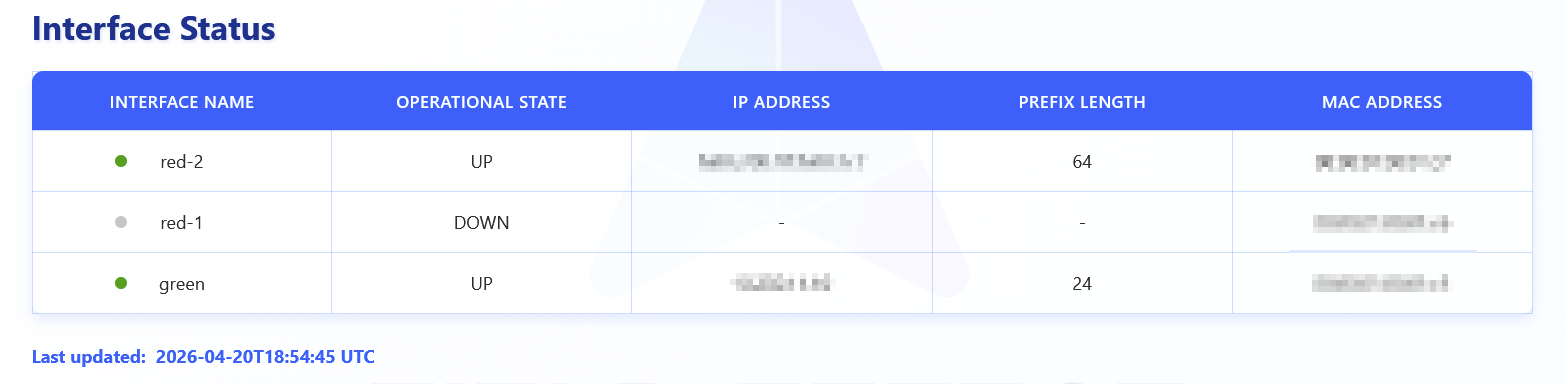
These statuses report on the sensor's network interface and ports. From here, you can find each network port's critical statuses and details, which include:
| Metric | Description |
|---|---|
| Interface Name | The name of the interface being referenced. Each interface represents a port on the sensor. To learn more about cabling your sansor and the ports, see the configuration guide for your device. |
| Operational State | Whether or not the interface is physically connected and operating as intended. This metric can be set to “UP” or “DOWN”. |
| IP Address | The IP address assigned to the interface. |
| Prefix Length | The prefix length for the interface’s configured subnet mask. |
| MAC Address | The sensor's MAC address. |
The number of rows for this report will vary depending on the network ports found on your sensor, and this report refreshes every hour.
Traffic Status
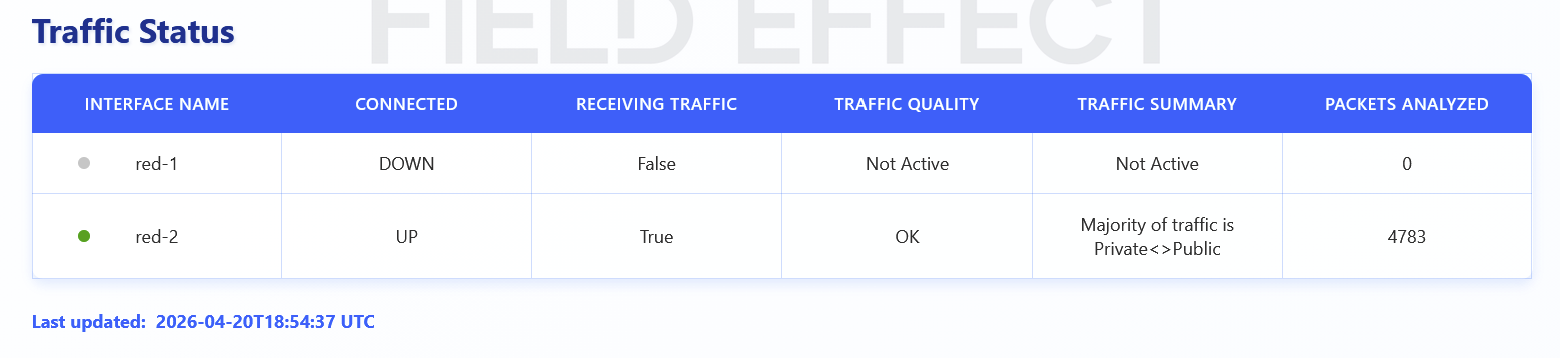
These statuses report on the traffic flowing through the sensor's network ports, and they are updated hourly. The following statuses are included for each network port:
| Metric | Description |
|---|---|
| Interface Name | The name of the interface being referenced. Each interface represents a port on the sensor. To learn more about cabling and the ports, see the configuration guide for your sensor. |
| Connected | Whether or not the interface is physically connected and operating as intended. This metric can be set to “UP” or “DOWN”. |
| Receiving Traffic | Reports on whether that network interface port is receiving traffic. This can be set to “TRUE” or “FALSE”, depending on whether the sensor is detecting incoming traffic on that port. |
| Traffic Quality | The sensor takes a small snapshot of incoming traffic and determines whether it's appropriate for your environment. This can be set to "OK", "Could be OK", or "Bad". The sensor requires visibility into the network's individual hosts that are connecting externally. This determination is based on: - The percentage of Public<>Private IP connections. - The presence of both responses and requests (not unidirectional traffic). - A sufficient number of individual hosts (Private IPs) in the traffic sample. |
| Traffic Summary | A summary of how the Traffic Quality was determined. |
| Packets Analyzed | The number of packets analyzed in the snapshot. |
Was this article helpful?
That’s Great!
Thank you for your feedback
Sorry! We couldn't be helpful
Thank you for your feedback
Feedback sent
We appreciate your effort and will try to fix the article