Introduction
The MDR Portal's Status page reports the health of your core Field Effect MDR services. From here you can:
- Verify everything is running as it should be.
- See if any services are degraded or offline
- See if any services need to be configured
This article introduces the Status page and covers the following topics:
Access the Status Page
For Partners:
This page behaves differently depending how the Organization Selector is set. When set to your provider view, all clients are shown as expandable saections.

When using a specific client view, that client’s core services are shown as expandable sections.
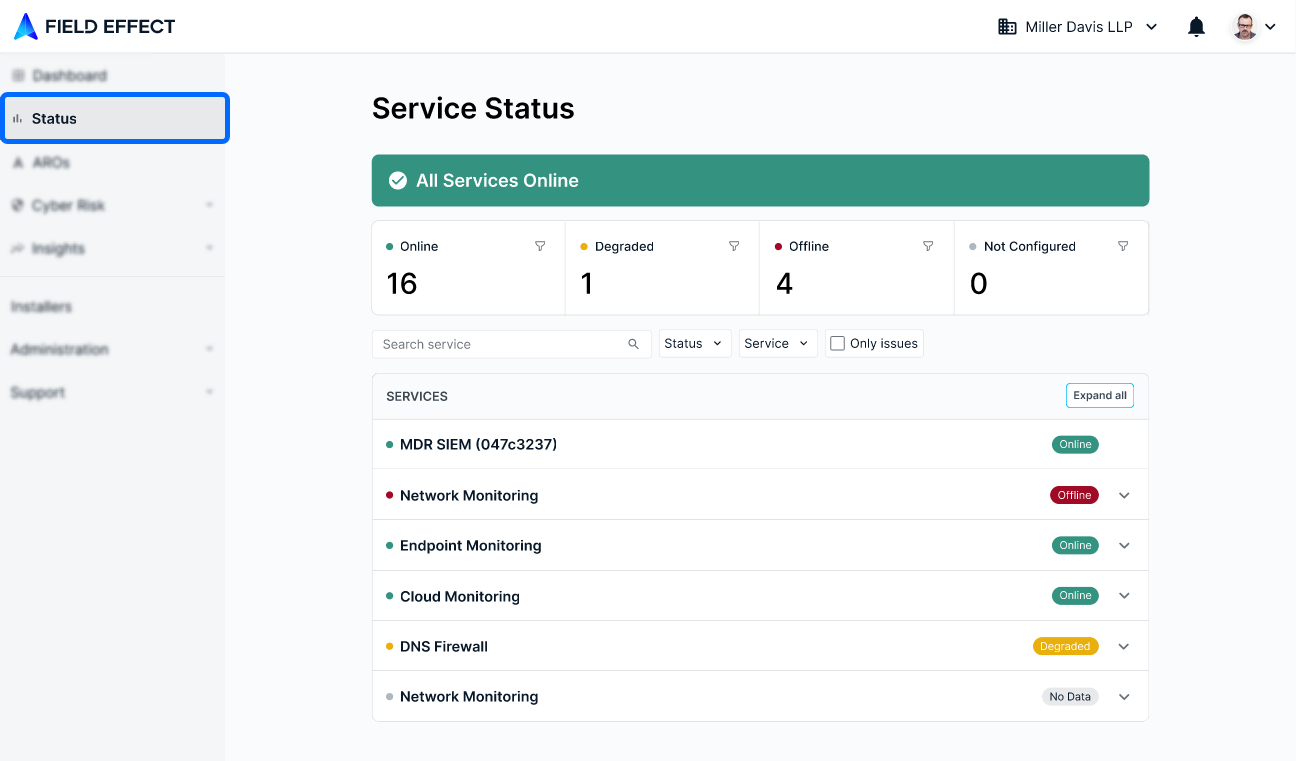
To access the Status page:
- Log into the MDR Portal
- Partners: set the organization selector to the preferred view
- Click Status in the sidebar
You will arrive at the status page, which is broken up into two sections:
- Dashboard: high level metrics about all service areas included with your MDR deployment.
- When set to the partner view, this metrics account for all of your end clients' services.
- Services Sections: expandable sections that offer more detail about each service and its status.
Dashboard
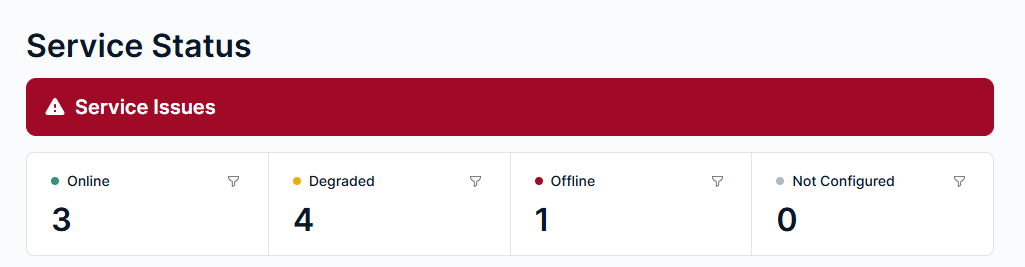
The dashboard shows the current status for each service included in your MDR deployment. The available statuses include
- Online: the service is operating as expected.
- Degraded: parts of the service are offline, or not reporting within the expected refresh interval.
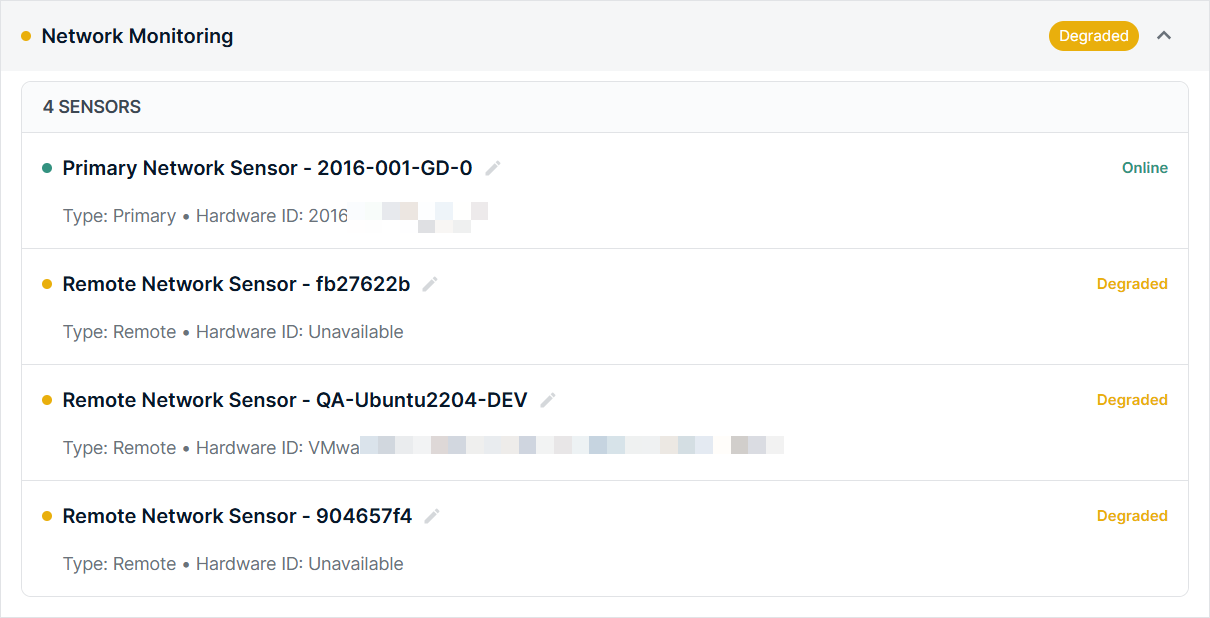
- Example: one remote network sensor is offline, but the primary sensor remains online.
- Offline: the service is offline and requires attention
Service Sections
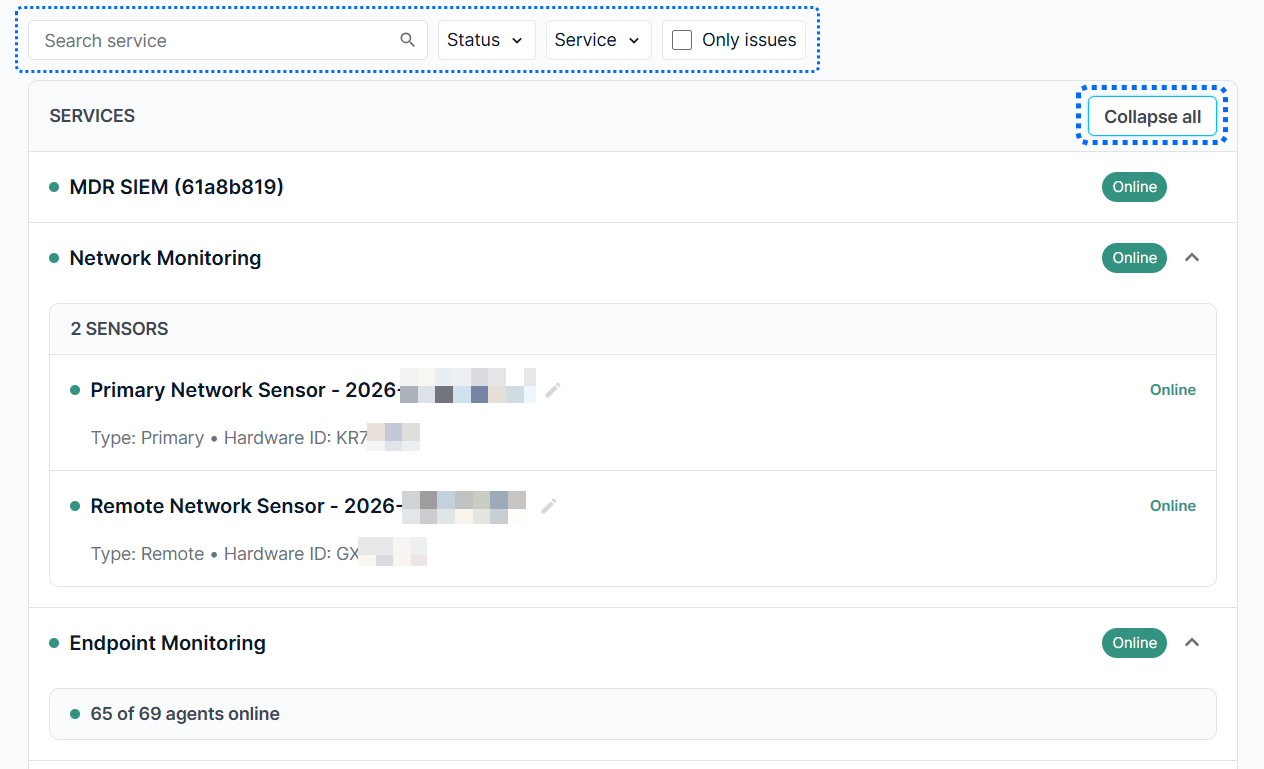
This section lists all of the services included in your deployment as expandable sections. The following sections will take a closer look at each.
Use the search bar and filters to quicky find the service you need, and the collapse/expand all button to adjust the view.
MDR SIEM
This section reports on the current status of your MDR SIEM sensors and is not expandable.
Network Monitoring
This section also relates to the network sensor(s) (primary and/or remote) found in your organization's deployment.
Every Field Effect MDR deployment typically includes one primary network SIEM sensor that performs the actual data analysis. For deployments spanning several physical locations or networks, there may be one or more secondary sensors in use to relay data back to the SIEM sensor for analysis.
This section also includes the hostname and Hardware ID for each sensor, which can be useful when troubleshooting a sensor with our Support team.
Rename Sensors
To give your sensors to more identifiable names:
- Click the pencil icon for that sensor.
- A new edit window will open. Give your new sensor a name ad click save

Endpoint Monitoring
The Endpoint Monitoring section will always show a green status, along with the total number of agents, and an online count. Offline agents may be the result of a device that is powered of or not connected to the internet.
If you haven't set up any endpoint agents in your environment, this section will be shown as grey until endpoint agents are installed and reporting traffic to a sensor.

Cloud Monitoring
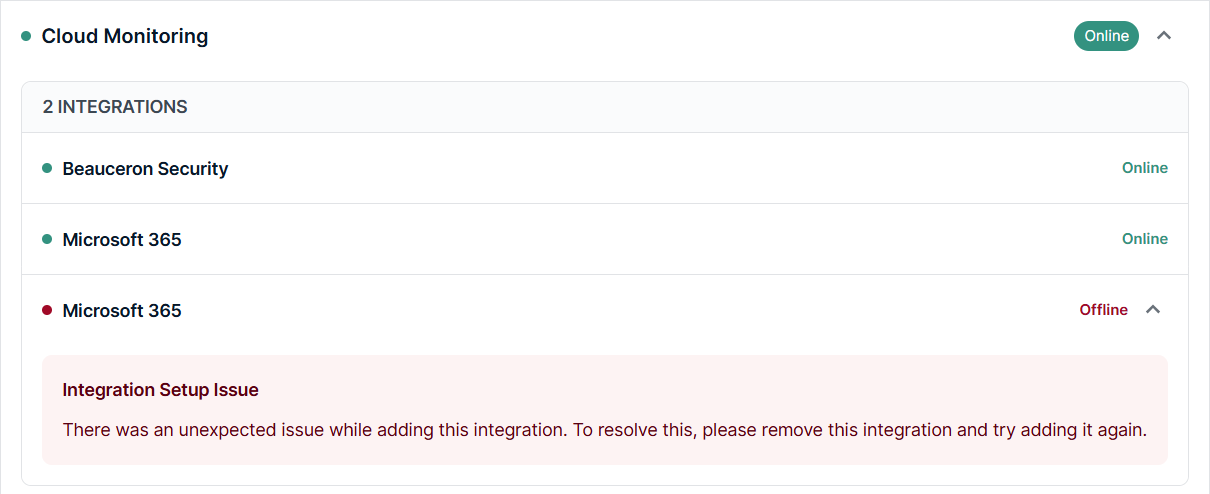
This section lists all cloud services your organization has enrolled for Field Effect MDR Monitoring. As your team complete integrations, they will appear here with a status.
Services experiencing issues will be marked with a red icon, and they are usually just a matter or reauthenticating the service.
DNS Firewall
When deploying Field Effect MDR, your Monitoring Profile was configured. During this process, "connections" were made for each physical network in the organization. See our Help Center article on setting up the DNS Firewall.
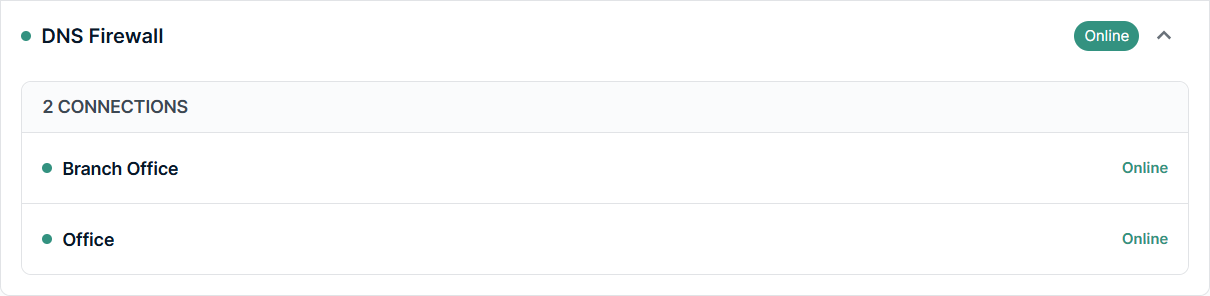
This status section reports the DNS Firewall status for each connection in your organization.
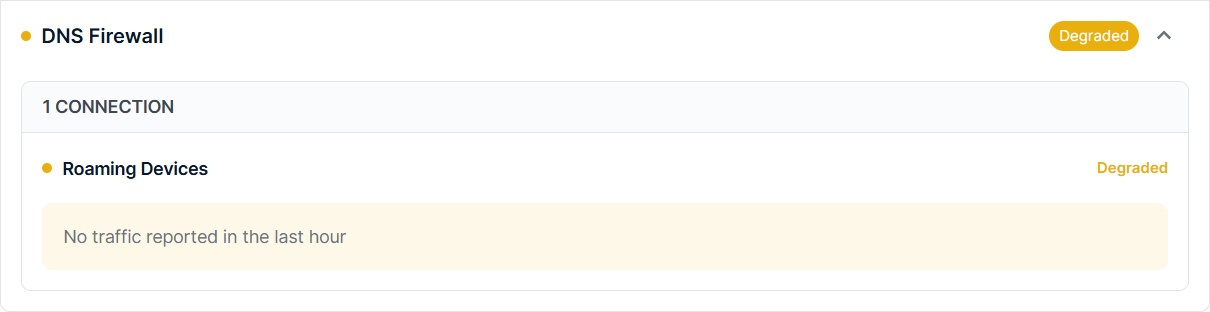
If a connection or roaming device does not report traffic for one hour, it is given a degraded status. Another scenario that can a degraded status is when the DNS API is offline. While the locations are protected, their exact status and configuration details are temporarily unavailable. Therefore, a degraded status is given.
If a DNS location has never reported traffic, it will take on a grey status. This is usually the result of the gateway device not being configured to point to our DNS server.
Was this article helpful?
That’s Great!
Thank you for your feedback
Sorry! We couldn't be helpful
Thank you for your feedback
Feedback sent
We appreciate your effort and will try to fix the article