Introduction
The Diagnostics page provides visibility into endpoint agent activity and agent upgrade history in the MDR SIEM Dashboard. This page is intended for investigations and troubleshooting by providing visibility into diagnostic data stored in the network sensor. This page does not replace the MDR Portal for configuring Field Effect services, responding to AROs, etc.
This page is currently available as a preview feature.
Use the Diagnostics page to:
- Review agent events and diagnostic messages.
- Filter logs by component, level, priority, status, or host.
- Investigate agent activity using UTC and local timestamps.
- Review endpoint agent upgrade history.
- Confirm upgrade, report, and task statuses.
- Export diagnostic information for further analysis.
This article covers the following topics:
Access the Diagnostics Page
- Log in to the MDR SIEM Dashboard.
- Select Diagnostics from the sidebar.
The Diagnostics page includes the following tabs: Agent Logs and Agent Upgrades.
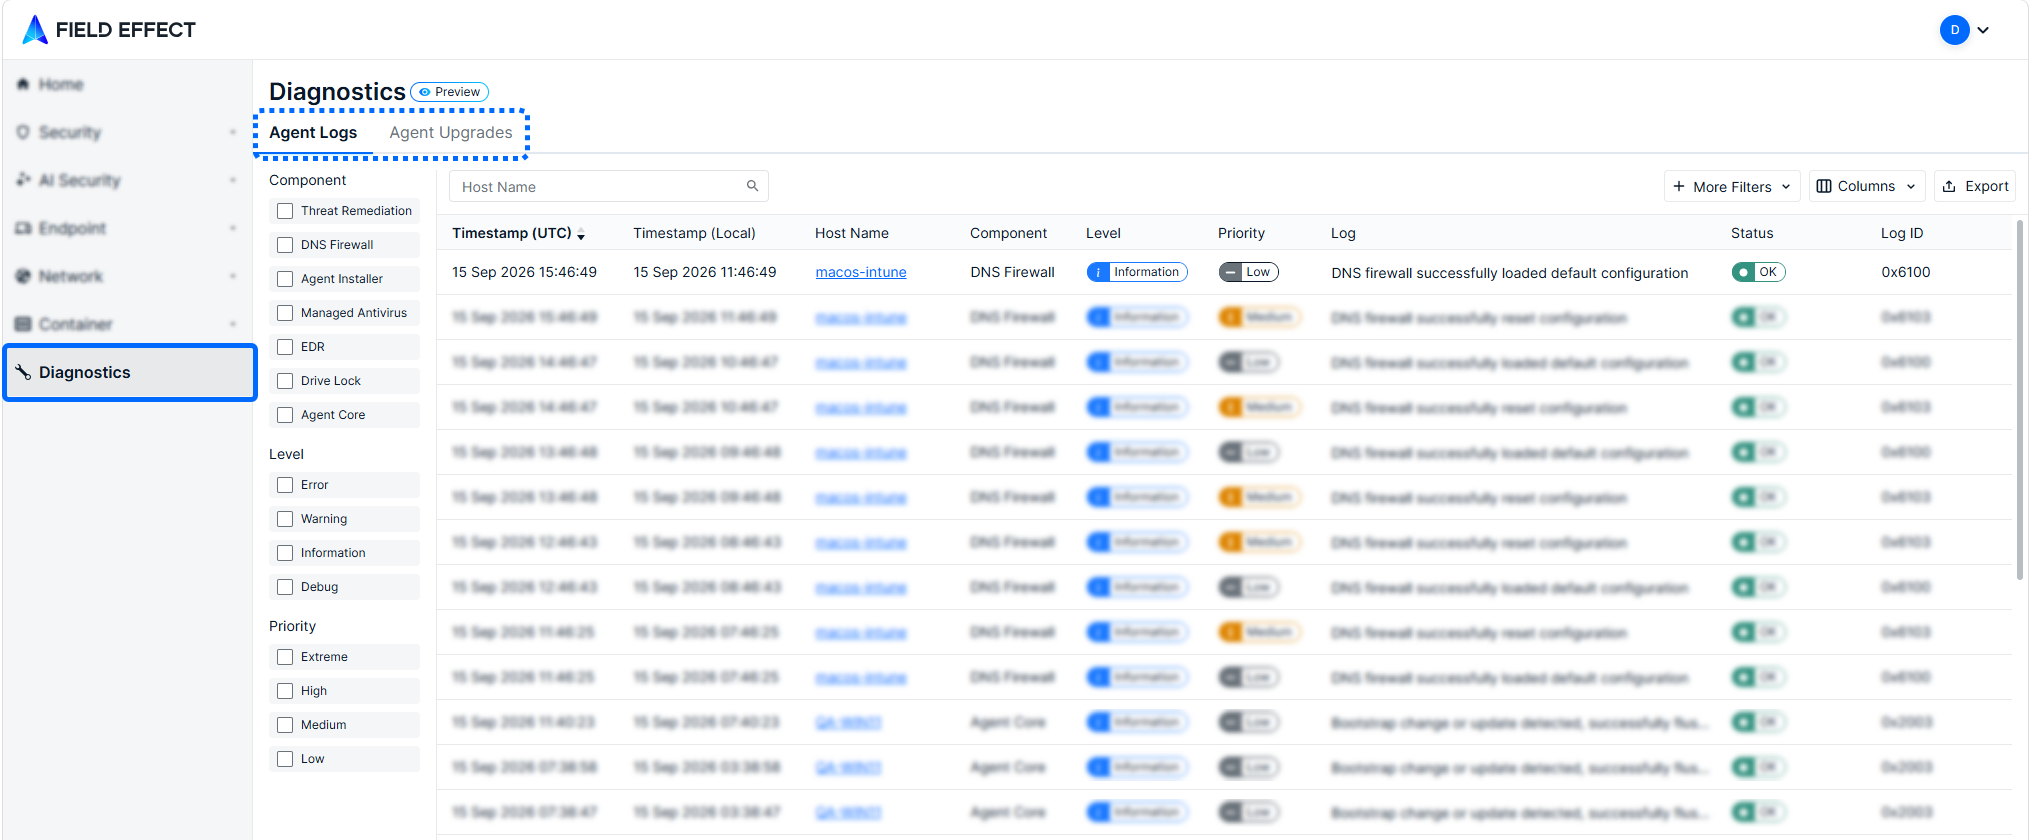
Agent Logs
The Agent Logs tab displays diagnostic events reported by endpoint agents.
Each event includes information such as:
- Timestamp (UTC): The time the event was recorded in UTC.
- Timestamp (Local): The time the event was recorded in the local time zone.
- Host Name: The endpoint associated with the event.
- Component: The agent component that generated the event, such as DNS Firewall, Agent Core, EDR, Drive Lock, or Zero Trust Networking.
- Level: The event severity, such as Information, Warning, or Debug.
- Priority: The priority assigned to the event.
- Log: A description of the event.
- Status: The processing status of the event, such as OK or Args Invalid.
- Log ID: The identifier assigned to the event.
Select a log row to review the available event details.
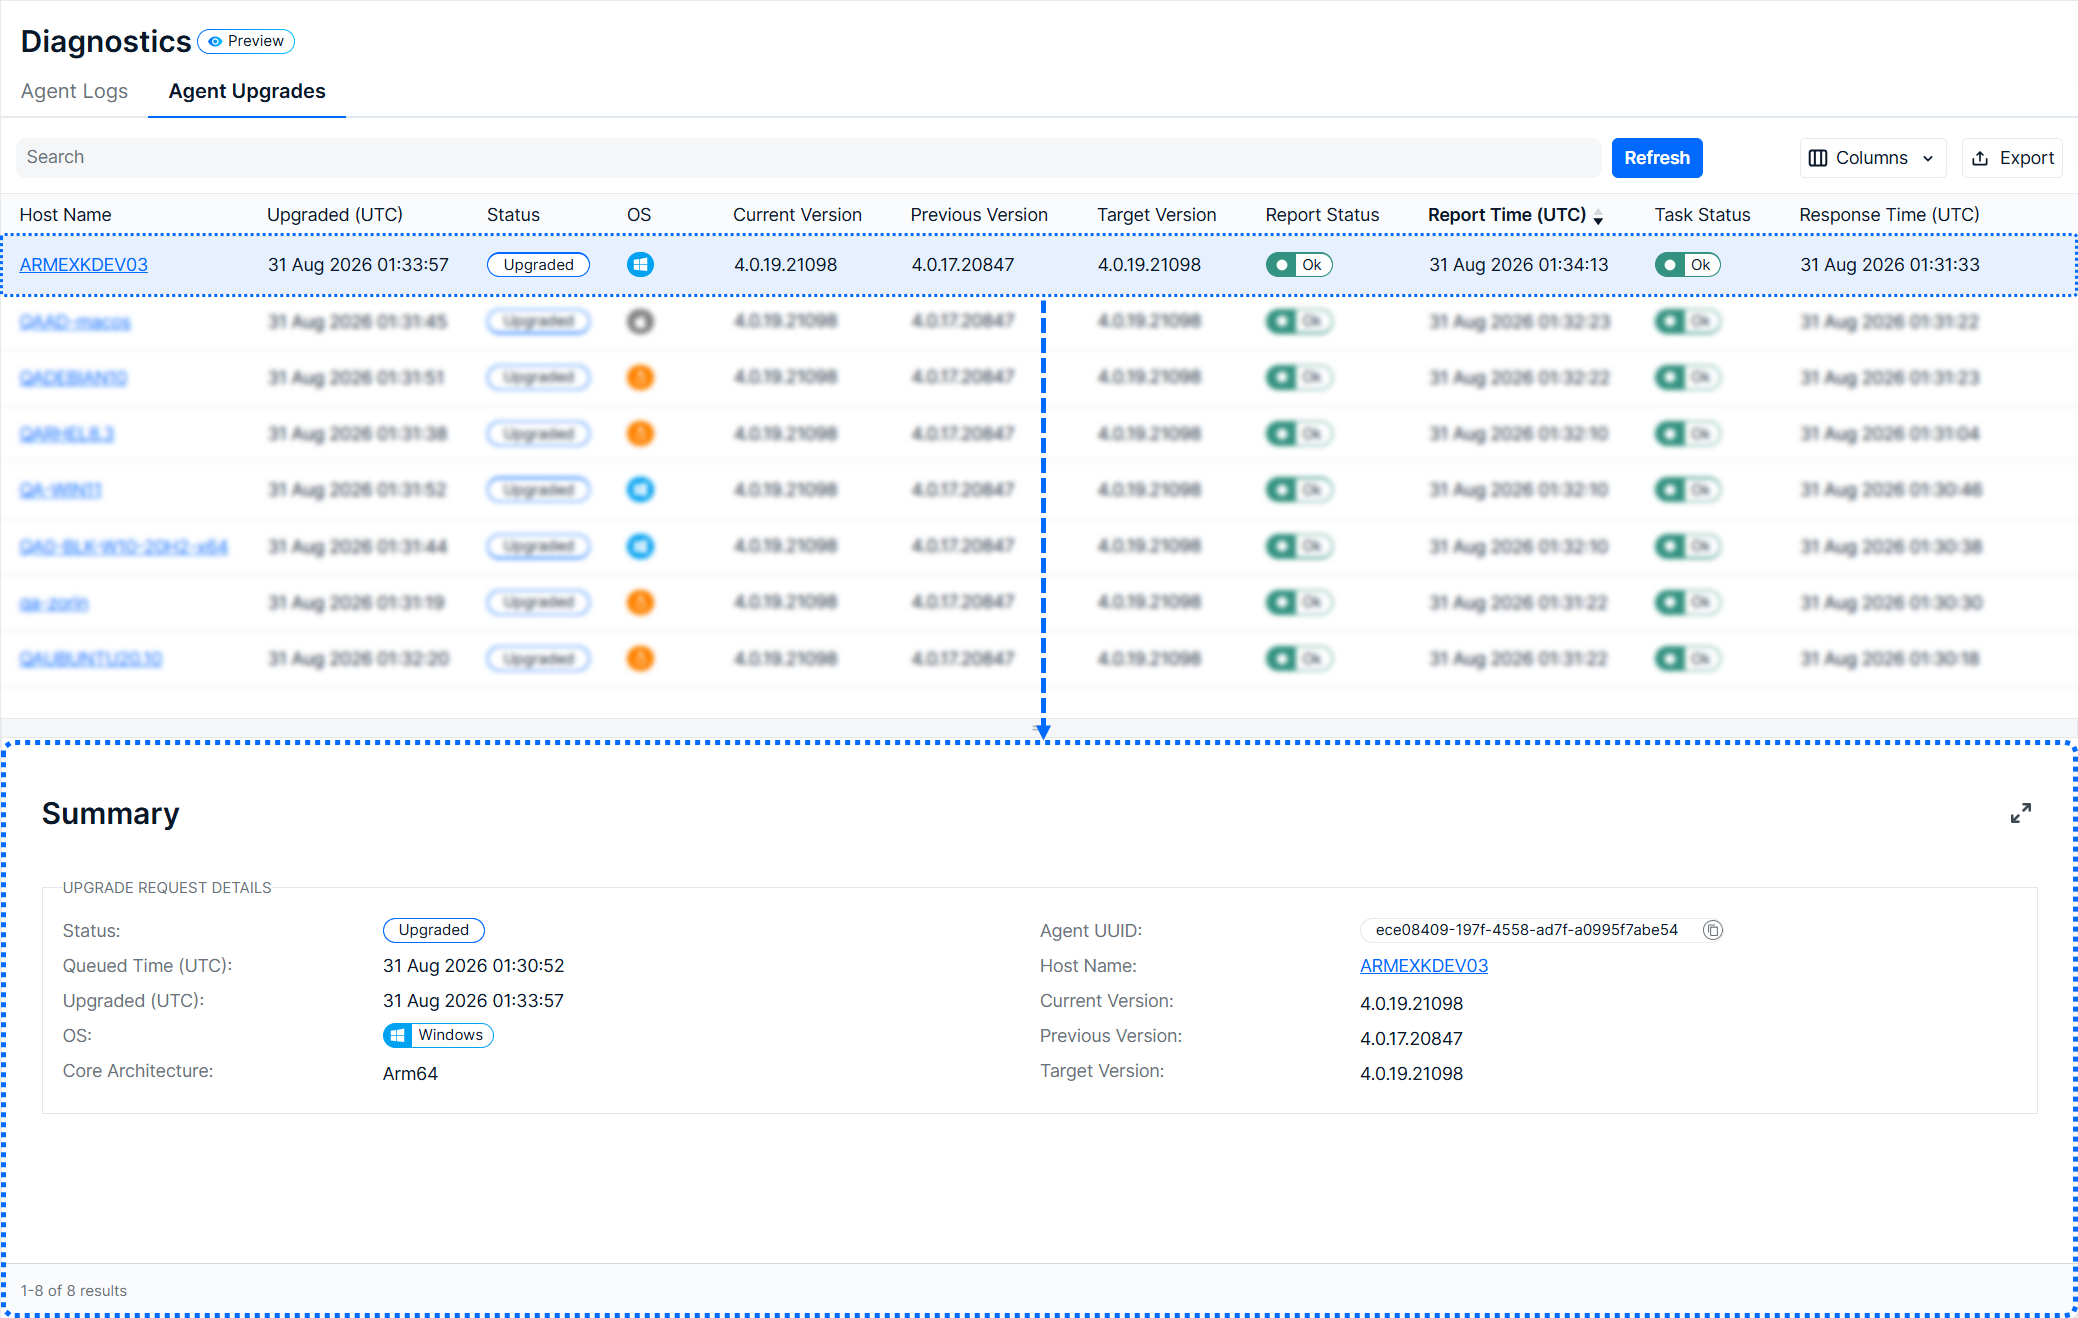
Use the filters on the left side of the page to narrow the results. When no filters are checked, all results are displayed. As soon as a filter is selected, the results will update.
You can filter by:
- Component
- Level
- Priority
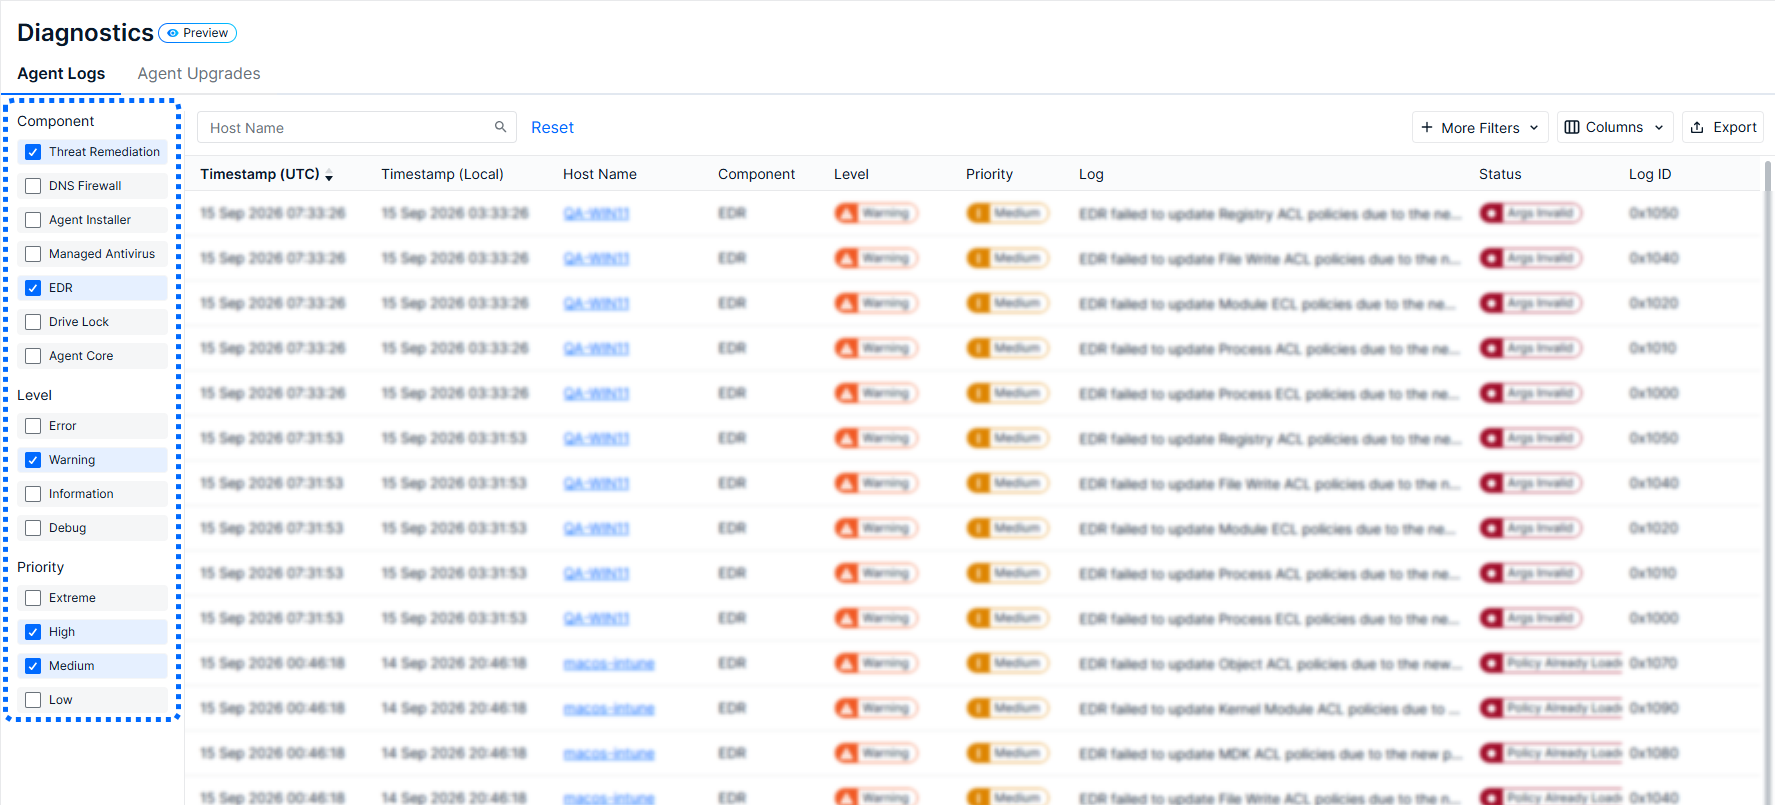
You can also use the toolbar to:
- Search for a host name or other text.
- Apply additional filters.
- Show or hide table columns.
- Export the displayed results.
The results table indicates the number of records currently displayed and the time the data was last updated.

Agent Upgrades
The Agent Upgrades tab displays the status and history of endpoint agent upgrades.
Each record includes:
- Host Name: The endpoint being upgraded.
- Upgraded (UTC): The time the upgrade completed, displayed in UTC.
- Status: The current upgrade state, such as Upgraded.
- OS: The operating system associated with the endpoint.
- Current Version: The agent version currently installed.
- Previous Version: The agent version installed before the upgrade.
- Target Version: The version targeted by the upgrade.
- Report Status: Whether the endpoint successfully reported the upgrade.
- Report Time (UTC): The time the upgrade report was received.
- Task Status: The status of the upgrade task.
- Response Time (UTC): The time the endpoint responded to the upgrade request.
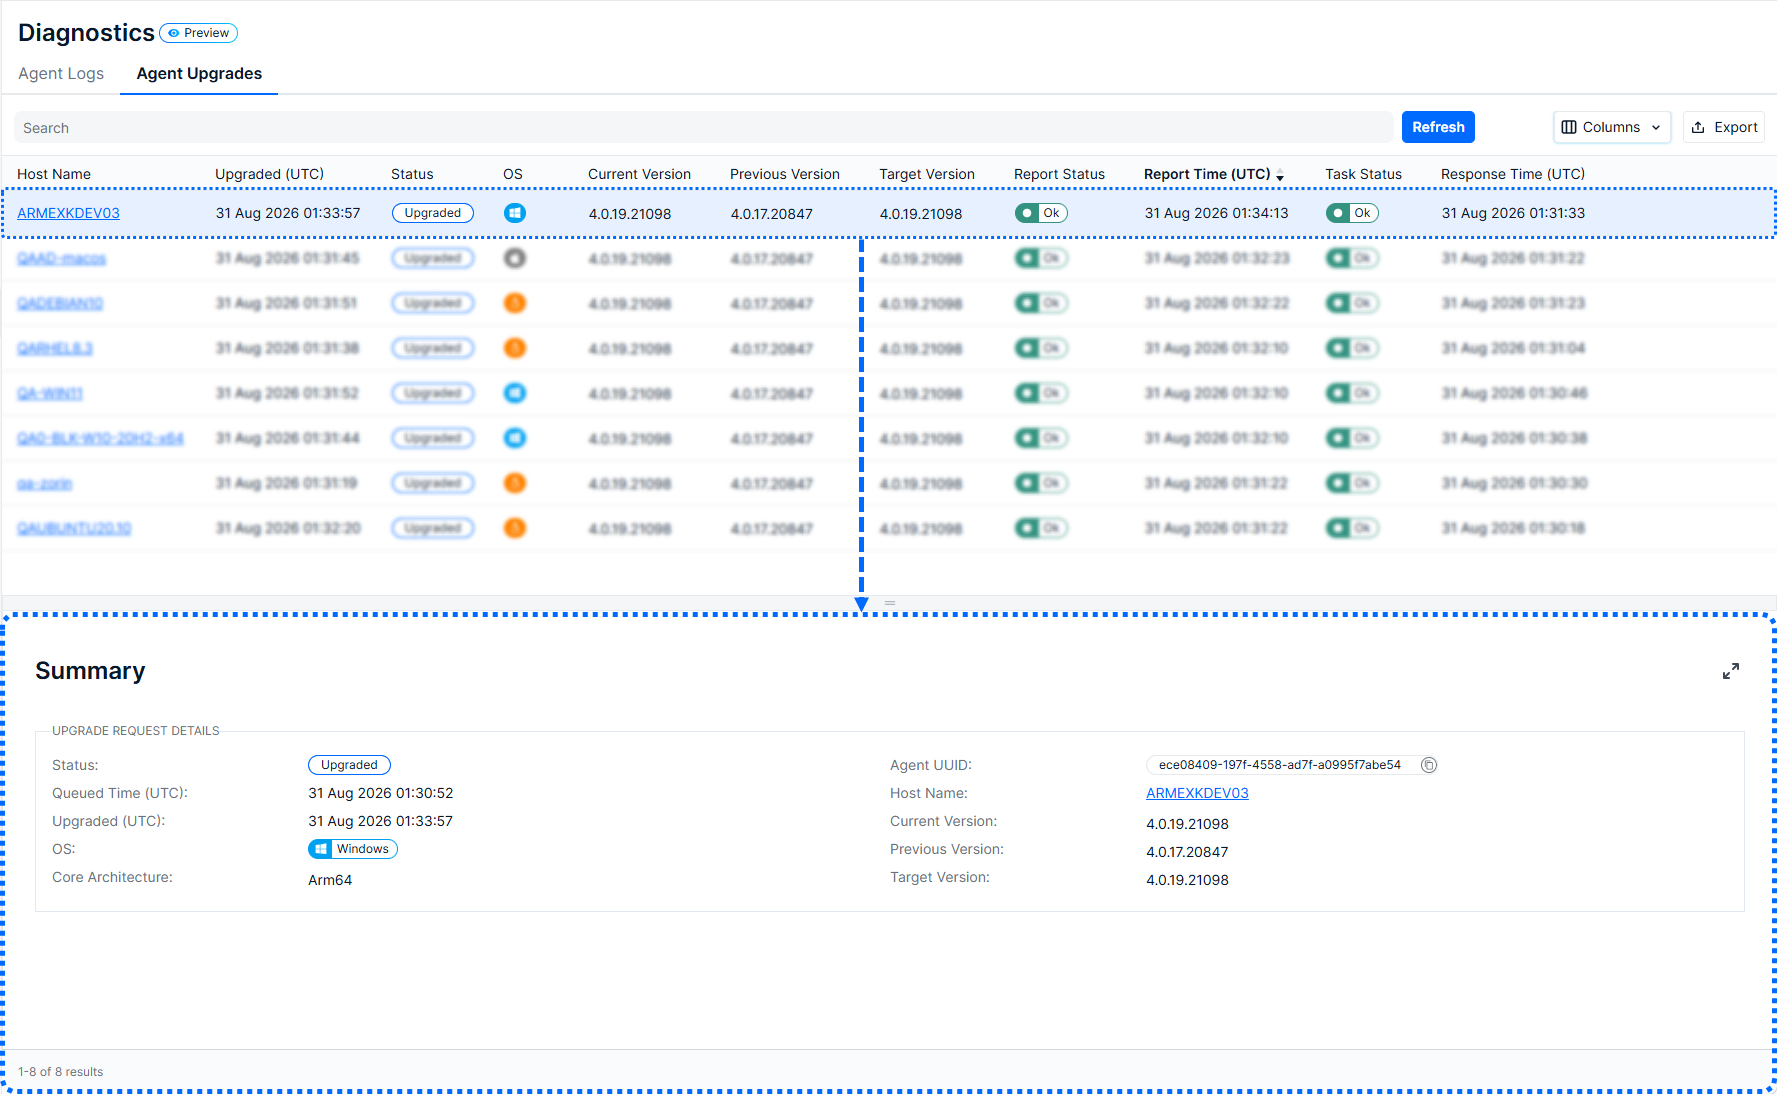
You can also use the toolbar to:
- Search for an agent upgrade.
- Show or hide table columns.
- Export the displayed results.

Understanding Statuses
Status labels provide a quick indication of whether an event or upgrade completed successfully.
- OK: The event or operation completed successfully.
- Upgraded: The agent upgrade completed.
- Warning: The event requires attention or indicates a non-critical issue.
- Args Invalid: The event contains invalid or unexpected arguments and may require further investigation.
For additional context, review the associated log message, host name, component, version information, and timestamps.
Was this article helpful?
That’s Great!
Thank you for your feedback
Sorry! We couldn't be helpful
Thank you for your feedback
Feedback sent
We appreciate your effort and will try to fix the article